Best Israel Investment for NA Investors?
Despite being conducting a 7 front war for much of the last 30 months, the Tel Aviv Stock Exchange (TASE) and it's leading index the TASE-35 have been leading the global markets.
If you've decided on allocating capital to the Israeli market, what instrument should you use to invest your capital? You can choose to invest directly in the exchange (TLV:TASE) or in one of a number of ETFs and Closed End funds like iShares Israel MSCI ETF (EIS). In this article, I'll review both opportunities in terms of three factors: absolute performance, liquidity of trading and breadth of investor activities.
Your Investment Choices: ETF or TASE
TASE 35 ETF - iShares Israel ETF (EIS)
Traded on the NYSE, this closed end fund has an AUM of approximately $900M and trades in USD and tracks the MSCI Israel Capped IMI index. A closer examination of the EIS ETF reveals that the ETF composition when compared to the TASE index comprises:
| Industry | iShares Israel ETF | TASE 35 |
|---|---|---|
| Financials | 32% | 31% |
| Technology & Defense | 37% | 36% |
| Real Estate | 8% | 10% |
| Healthcare | 10% | 10% |
| Industrials & Diversified | 13% | 12% |
Source: Blackrock, TASE
It should be noted that EIS is different from the TASE 35 because it essentially has exposure to Nasdaq-listed companies like Monday.com, Check Point and others that are primarily traded outside of Israel. So while the TASE comprises a basket of domestically traded securities, EIS is a basket of Israeli-domiciled securities. As a result, this ETF holds between 110 and 118 stocks in its portfolio.
EIS Average Daily Volume (ADV) is between $12 and 15 million. Alternatively, the VanEck Israel ETF (ISRA) that tracks the BlueStar Israel global Index at $150million of AUM and ADV of less than $1 million.
TASE LTD Stock
Shares in Tel Aviv Stock Exchange Ltd, trade (unsurprisingly) on the TASE only, there are not ADRs or special securities for non-Israeli investors. From a business perspective, unlike most North American exchanges, which are focused on a specific type of security, the TASE manages trades across six broad asset class categories: equities, corporate bonds, government debt instruments, index-tracking products (ETFs and ETNs), mutual funds, and derivatives. As with all exchanges, the TASE receives compensation primarily from the trading volume of the securities registered on the exchange, so as trading volume increases, so does gross revenues and thus net profit.
In terms of number of share listings, the traditional equity market segmentation falls along the Israeli economy: Technology & Defense (30%), Financials (20%), Real Estate (15%), Energy (8%), Healthcare & Biomed( 10%), Consumer, Industrial, Telecom (10%). 130 of the 736 listed companies are listed on another exchange (Cross listings), the most recent of which is Palo Alto Networks.
When reviewing the Average Daily Trading Volume by asset class the numbers look like those in this chart:
| Asset Class | 2023 ADV | 2024 ADV | 2025 ADV | 2023→2024 Change | 2024→2025 Change |
|---|---|---|---|---|---|
| Equities | ~2.0B | ~2.2B | ~3.4B | +10% | +57% |
| Government Bonds | ~2.9B | ~3.4B (Q1 peak) | Moderating (↓ issuance) | +~18% | ~Flat to modest decline |
| Corporate Bonds | ~1.1B | ~1.2–1.5B | ~1.5–2.0B (est.) | +14% | +~30–40% (est.) |
| T-Bills (Makam) | ~1.4B | ~1.9B | ~1.5–1.8B (est.) | +38% | ~Stabilizing |
| Mutual Funds | ~1.4B | ~1.8B (9M avg) | Accelerating upward | +29% | Significant growth |
| Derivatives | Baseline | +25% vs. prior | Continued growth | +25% | Growing |
Note: 2025 corporate bond, T-bill, and mutual fund figures are estimates derived from issuance data and directional commentary in quarterly reports; TASE does not publish standalone ADV for all sub-categories in its annual results.
Key Market Structural Observations about the TASE
The bond market is larger than equities. Even at an equity ADV of NIS 3.4 billion in 2025, combining government bonds (NIS 3B+), corporate bonds (NIS 1.5B+), and T-bills (NIS 1.5B+) produces an estimated total bond ADV of NIS 6–7 billion. The bond market is roughly twice the size of the equity market on a daily trading volume basis which is consistent with Israeli institutional allocations that are heavily weighted to fixed income.
Equities are the growth story. The 57% surge in equity ADV in 2025 is exceptional by any standard. The shift from NIS 2B to NIS 3.4B daily represents the highest equity trading velocity in TASE's history, driven by the combination of strong returns, ceasefire optimism, record retail account openings, and significant foreign inflows.
Government bond volume is cyclical around war financing. The peak in government bond ADV in early-to-mid 2024 (NIS 3.4B) reflects the most intense phase of war-related deficit financing. As the security situation improved through 2025 and the Ministry of Finance's borrowing needs moderated, thus government bond issuance and secondary trading has eased.
Corporate bonds are structurally expanding. The number of active corporate bond issuers (including many from the United States) reached a decade-long high of 100 companies by end of Q3 2025, meaning the investable universe itself is growing, not just turnover of existing securities. This is a sign of market deepening.
Thus the growing areas of trading volume are reflective of growth in the underlying equities market as both mutual funds and derivatives are based on the underlying equities. Of course, as the only exchange trading all of these securities, the TASE is the “House” for all things in the Israel capital markets, so as volume goes up, the House keeps on winning.
Comparison 1 - Absolute Performance
The EIS ETF
Reviewing the performance of the TASE-35 ETF for both 2024 and 2025, we find that the ETF (in USD) grew by 35% and 45% respectively for a cumulative gain of almost 95%. So the ETF value doubled in less than 2 years. For context, during the same 2025 period, the S&P 500 rose 18% and the NASDAQ-100 gained 22%, meaning the TA-35 materially beat major global benchmarks by 30+ percentage points. Top holdings in the ETF are Teva, Bank Leumi, Bank HaPoalim, Elibit Systems, Tower Semiconductor and Checkpoint Software.
The recovery story is war-driven: the index took a sharp blow at the October 2023 Hamas attack and then staged a powerful V-shaped recovery. Catalysts included the ceasefire agreement, Operation Rising Lion against Iran, and a surge in defense sector demand both domestically and internationally — with insurance & defense stocks among the standout leaders, some gaining 150–278% on the year.
TASE Stock
The TASE stock itself has been even more explosive on a price basis and only trades in NIS. On strong trading volumes, the company's market cap increased by nearly 225% in 2025, reaching NIS 9 billion in December 2025 and NIS 15.0 billion as of early March 2026, when compared to the just NIS 2.0 billion in January 2024, the two year growth rate is 350% and 6.5x to March 2026. This corresponds to recently reported 2025 results from the TASE, wherein the exchange had year over year revenue, net income and EBITDA growth of 29%, 79% and 58% respectively, accordingly the board declared a NIS 1.56 dividend per share to be paid on March 20, 2026.
Comparison 2 - Liquidity of Positions
As previously stated, EIS has approximately an ADV of between 100 to 130,000 shares worth $10 to 12 million trading each day on a $900M AUM. TASE has an ADV of 500,000 to 750,000 shares for around $10 to 15 million on a market cap of NIS 15 billion (approximately $5 billion). So on a value basis, both securities trade in approximately the same amount
When we examine each of these instruments more closely we see how they structurally diverge.
| Liquidity Metric | EIS | TASE Ltd. Stock |
|---|---|---|
| Exchange | NYSE Arca (US) | Tel Aviv Stock Exchange only |
| Current AUM / Market Cap | $885M | NIS 15.1B (~$4.9B) |
| Avg Daily Volume (shares) | 100–130K shares/day | 487–760K shares/day (NIS-denominated) |
| Avg Daily Value Traded (USD) | $12–15M/day | $10–15M/day (at current price) |
| Settlement | T+1 (US standard) | T+2 (TASE standard) |
| Bid-Ask Spread | Very tight (~1–2 cents) | Wider; due to thin order book |
| Short selling possible? | Yes, easy to borrow | Yes, limited international access |
| ADR / US access? | Yes — NYSE Arca | No — no ADR exists |
| 1-Year Net Inflows (EIS) | +$399M | N/A (single stock) |
| AUM growth (1Y) | +$618.97M in 1 year | Market cap +248% in 1 year |
The headline daily value traded figures look similar at $10 to 15 million per day for both instruments. However, the liquidity profiles are structurally different. EIS benefits from the ETF creation/redemption mechanism that institutional investors can transact in large blocks through authorized participants without meaningfully moving the market price. There is no equivalent depth mechanism for TASE stock. At its current price of NIS 16,000 per share, the order book is naturally thinner at the margin, and the reported average daily trading volume of 760,209 shares (Investing.com) is an average skewed by high-volume days around results releases and news events thus trading liquidity on quiet days is materially thinner.
The more relevant structural issue is access: EIS is available to any US brokerage account. TASE stock requires an Israeli or TASE-connected brokerage relationship, which disqualifies the vast majority of international institutional and retail investors.
Comparison 3 - Breadth of Positions
In addition to liquidity, an understanding of the ownership of the underlying securities helps us assess and understand how to best hold access to the opportunity.
EIS investor base: EIS is held by a global, diversified institutional investor base. According to ETF Database, net fund flows over the past 12 months have totaled $399.35M, and over the past 3 months $228.95M (ETF Database) — these flows reflect active allocation decisions by US-registered pension funds, endowments, family offices, ETF model portfolio allocators, RIAs, and hedge funds with international equity mandates.
EIS is accessible on every major US brokerage platform (Fidelity, Schwab, Vanguard, TD Ameritrade, etc.) and is eligible for tax-advantaged accounts (IRAs, 401ks). The creation/redemption flow data implies broad-based, growing institutional demand and not just speculative positioning. Short interest data from FINRA exists and is transparent, enabling a clear read on sentiment.
TASE Ltd. Stock investor base: The investor base is far narrower by geography and structure. It is dominated by Israeli institutional investors (pension funds, Israeli mutual funds and insurance companies) and Israeli retail investors. International access is effectively limited to hedge funds and family offices with TASE direct brokerage relationships (there are approximately 20 or so domiciled in Israel). On the bright side, there were approximately 200,000 new retail accounts opened in 2025 across the broader TASE market and Stock Titan speaks to growing domestic retail participation, but this is market-wide retail growth, not specific to TASE stock itself.
TASE stock's analyst coverage is non-existent, we couldn’t find even one sell-side analyst that is currently covering the stock . Recently the TASE switched from a trading week of Sunday to Thursday to the traditional Monday to Friday week like the Dubai exchange did several years ago. At present, the early results from the Mon-Fri trading week transition are attracting global investors to Friday sessions, which may over time broaden international participation in TASE-listed securities generally — but this has not yet meaningfully broadened the TASE stock's own shareholder base beyond the main institutional players and, of course, Bill Ackman and Neri Oxman, who famously bought 4.9% for $25 million in January 2024 (not a bad investment return to say the least!).
Bonus Analysis: Impact of Forex on Performance
The depreciation of the USD vs the NIS over the last year has had a stark impact on the manner in which all assets denominated in NIS have appreciated in value in relation to US investors.
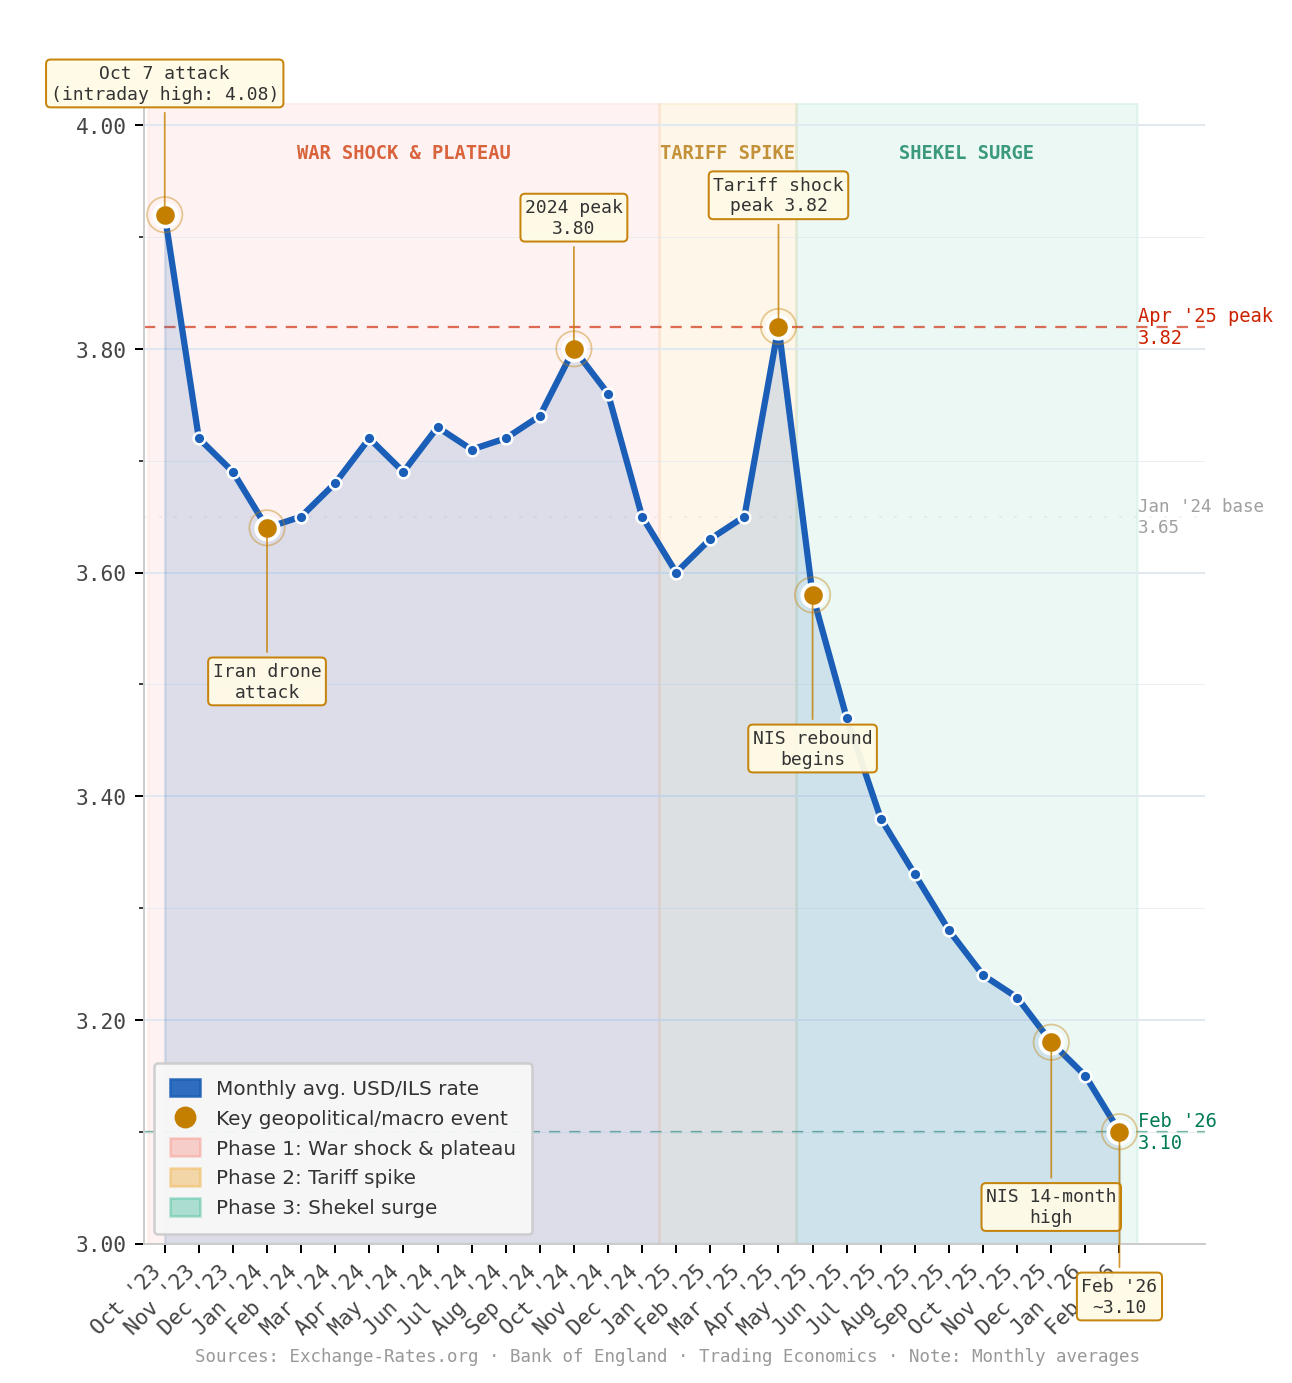
In fact, when we examine the NISUSD exchange rate, we find that since October 7, 2023 there are three distinct performance zones:
October 2023 to January 2025 - this is the period where Israel was beginning its active Kinetic events amongst its neighbors and the 7-front war
January to April 2025 - this period is exemplified by the installation of the new US administration and its policies and events, including the announcement of tariffs on Israeli goods and services
May 2025 to the present - dubbed the Shekel Surge, a period where the US dollar has consistently depreciated against the NIS and other foreign currencies
Combined, these actions look as follows:
As a result of the appreciation of the NIS we must then review the performance of each of these vehicles in dollar denominated terms because EIS invests in both USD and NIS securities and TASE by definition is only available in NIS.
How FX Impacted EIS
EIS is denominated in USD but holds NIS-priced Israeli assets. It has no currency hedge so the mechanism is straightforward: when the shekel strengthens, the USD value of its Israeli holdings rises automatically, adding a FX tailwind on top of local equity returns. When the shekel weakens, the reverse occurs.
2024 FX impact on EIS: The shekel was essentially flat to slightly weaker versus the dollar across 2024. The year's EIS NAV return of +33.8% was therefore almost entirely driven by local Israeli equity gains, with FX contributing a minimal negative drag of roughly -1 percentage point.
2025 FX impact on EIS: This is where FX became a significant and underappreciated contributor. The USD/ILS rate fell 12.49% in 2025, meaning the shekel strengthened 14% against the dollar. EIS's 2025 NAV return of +45.6% in USD therefore consisted of approximately +31–32% from local Israeli equity gains and approximately +13–14 percentage points of pure FX tailwind. In other words, roughly 30% of EIS's 2025 USD return was FX-derived, not equity-derived.
This is a critical distinction for forward-looking analysis: if the shekel were to merely revert back to the mean of it’s 2024 average of 3.65 from today's 3.10, that would represent a ~18% dollar appreciation — which would subtract roughly 15 percentage points from EIS's USD-denominated return in that scenario even if Israeli equities were flat.
2026 YTD FX impact on EIS: The shekel has strengthened 0.25% over the past few months and is up 14.77% over the last 12 months, so the FX tailwind has continued modestly into early 2026. The 12-month trailing USD/ILS decline is approximately -14.77%, confirming ongoing shekel strength. Year-to-date in 2026 the shekel has added a small further positive FX contribution to EIS returns.
Summary for Return Attribution for EIS:
| Year | EIS NIS Return | FX Contribution | EIS USD Return |
|---|---|---|---|
| 2024 | ~+35% | ~-1% | +33.8% |
| 2025 | ~+31–32% | ~+13–14% | +45.6% |
| 2026 YTD (Mar 9) | ~+8% est. | ~+1% | ~+9% |
| Full Period | ~+90% | ~+17% | ~+100% |
The FX contribution added approximately 10–12 percentage points to EIS's cumulative USD return over the full period. Without the shekel's appreciation, EIS would have returned roughly +85–88% rather than ~+100%.
How FX Impacted TASE Ltd. Stock
TASE stock operates differently. Its revenues, costs, dividends, and share price are all denominated in NIS. A USD-based investor's experience is therefore entirely a function of: (1) TASE's NIS share price appreciation, and (2) how many dollars each NIS is worth at exit.
2024 FX impact on TASE stock: TASE stock gained roughly +17–18% in NIS terms in 2024. With the shekel effectively flat (-1% vs. dollar), the USD return was also approximately +16–17%. FX was essentially neutral.
2025 FX impact on TASE stock: TASE stock's NIS return in 2025 was approximately +110–115%. The shekel then added ~+14% on top. The dollar-denominated return was therefore approximately +135–140%, with FX contributing roughly 20–22 percentage points of USD gains on top of the extraordinary local price appreciation.
The FX effect here is proportionally larger in absolute dollar terms than for EIS, simply because the base equity return was so much larger. A 14% FX tailwind applied to a +110% NIS gain translates to a much bigger dollar increment than the same FX tailwind applied to EIS's +31% local gain.
2026 YTD (to March 9): TASE stock has continued to surge in NIS terms, up approximately +50–55% from the start of 2026 through its March 5 all-time high. The shekel has contributed a further small additional tailwind of ~1–3% in USD terms.
Summary for Return Attribution TASE Stock:
| Year | NIS Return | FX Contribution | USD Return |
|---|---|---|---|
| 2024 | ~+17–18% | ~-1% | ~+16–17% |
| 2025 | ~+110–115% | ~+14% | ~+135–140% |
| 2026 YTD (Mar 9) | ~+50–55% est. | ~+1–2% | ~+52–57% est. |
| Full Period | ~+375–400% | ~+17% | ~+450–470% |
So it’s important for investors to attribute their returns to the correct sources, whether they be related to underlying performance of the stocks or the currency in which those stocks operate and to that which is relevant to the investor.
So Which One Should I Pick?
When we summarize our analysis via a quick scorecard we estimate the best choice:
| Dimension | EIS | TASE Ltd. Stock | Advantage |
|---|---|---|---|
| Absolute Return (2Y, USD) | +100% | +430–450% | TASE Stock (decisive) |
| Momentum (current) | Steady, broad-based, near ATH | Explosive, concentrated, at ATH | TASE Stock (with higher risk) |
| Trading Liquidity | Deep, US-accessible, ETF mechanic | Thinner, TASE-only, no ADR | EIS (decisive) |
| Breadth of Participants | Global institutional, broad access | Domestic-dominated, thin coverage | EIS (decisive) |
| Valuation | P/E 14.85x | P/E 100x+ | EIS |
| Volatility | ~20% annualized | ~7.65% daily | EIS |
For North American investors, EIS is likely the best way to participate in the overall Israeli market. It’s easy access on various investing platforms, 0.60% management fee and broader portfolio diversification (up to 118 shares instead of just 1) with a similar liquidity position. In addition, its valuation is 6 times cheaper than the TASE stock itself. However, if you’re going to make a “bet” on the Israeli domestic economy, purchasing TASE seems to be the best option for longer term investors.
Of course, none of this is investment advice, it’s just me doing some basic analysis of how a US or Canadian investor can join part of the Israel broad market environment.