
3 Roads to US Drug & Medical Device Acceptance
A side-by-side look at the timelines, gatekeepers, costs and the probability of success for each offering resulting from the FDA approval
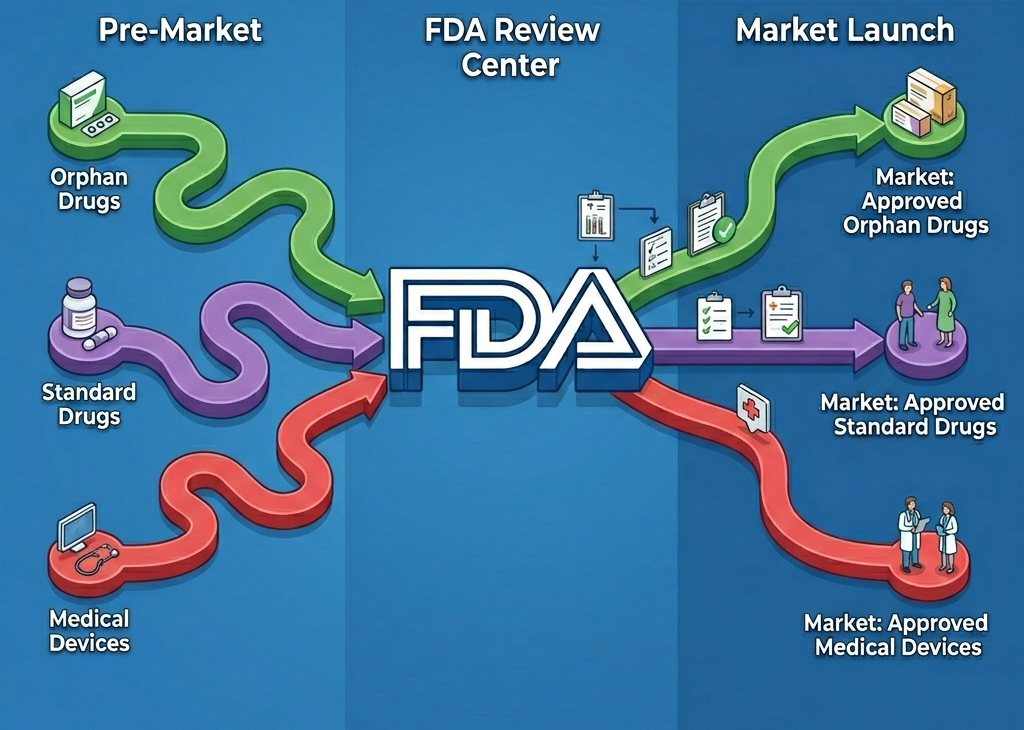
When I started my journey as a medical therapeutics and device investor, I became easily confused as to how each technology would approach the US market. Having given this some thought lately from discussions with prospective clients we're working with, I thought I'd lay out the three main FDA pathways for medical technology companies.
Every product that reaches a US patient has a paper trail behind it that most people never see. A pill, a rare-disease therapy, and a heart valve all answer to the same agency, but the road each one travels is shaped by a different statute, a different review division, and a different definition of what counts as proof.
For founders, investors, and operators, understanding those differences is not academic. The pathway dictates the burn rate. It dictates the trial design. It dictates when the first dollar of revenue can plausibly land. Below is a comparison of the three most common US regulatory journeys, with the timelines and gatekeepers laid out visually before each narrative.
The Standard Drug Pathway

The conventional small-molecule or biologic drug spends roughly a decade in development before it can be prescribed. The infographic above maps the full 8.5 year arc through CDER, starting in a discovery lab and ending at a PDUFA decision date.
What strikes most newcomers is how front-loaded the risk is. A molecule entering Phase 1 has only a 7.9% chance of ever reaching the market, according to BIO's analysis of more than 12,000 development programs. Phase 2 is where most candidates die. It carries a 28.9% transition rate, which is the single biggest cliff in the entire pipeline. By the time a sponsor reaches Phase 3, the odds finally tilt favorable. Phase 3 to NDA submission clears 57.8%, and the FDA itself approves roughly 90.6% of NDAs it accepts for review.
The regulatory gates are well known but worth restating. The Investigational New Drug (IND) application opens the door to human testing. Sponsors file it, wait 30 days, and absent a Clinical Hold the trial can begin. The NDA or BLA is the second formal handoff, where years of clinical data get packaged for review. A PDUFA date is then set, typically ten months out for standard review and six months for priority review.
The economics are unforgiving. A sponsor running a Phase 3 cardiovascular trial can spend more on a single study than most startups raise across their entire life. Investors price that risk by demanding multi-bagger returns on the survivors. Pricing committees defend it by pointing to the failures the survivors are subsidizing. Both arguments are partly correct, and neither makes the timeline any shorter.
The thing to remember is that the drug pathway is not really one pathway. It is a chain of independent gates, and at each gate the agency, the data, and sometimes the science itself can quietly close the door.
The Orphan Drug Pathway

Orphan drugs follow the same scientific arc as standard drugs, but the surrounding incentive structure changes the math in ways that show up clearly in the infographic above. The clinical sequence is shorter on average, the success rates are meaningfully higher, and the regulatory wrapper is built to reward sponsors for tackling diseases that the open market would otherwise ignore.
Orphan Drug Designation (ODD) is the foundational gate. A sponsor files Form 4035 with the Office of Orphan Products Development, gets a 90-day binding decision, and if granted unlocks a stack of benefits. Seven years of marketing exclusivity. A 25% tax credit on qualifying clinical costs. A waived PDUFA filing fee that ran roughly 4.3 million dollars in 2025. Plus the option to layer Fast Track, Breakthrough Therapy, or Accelerated Approval on top.
The success data tells a quieter story that often gets lost in press releases. BIO's orphan-specific analysis shows Phase 1 to 2 transition at 67.4%, Phase 2 to 3 at 44.6%, and Phase 3 to NDA at 60.4%. Compound those rates and the overall likelihood of approval from Phase 1 sits at about 17%, more than double the rate for non-orphan compounds. The NDA approval rate for orphan drugs runs 93.6%, and median FDA review time for these products has held around 244 days across recent analyses.
Why such a gap? Three reasons that any operator in this space already knows. Endpoints are often simpler because the disease biology is cleaner, with fewer confounding comorbidities in small patient populations. Sponsors typically have closer, ongoing dialogue with the agency through Type B and Type C meetings. And the patient advocacy infrastructure is unusually active, which speeds enrollment and sharpens trial design.
None of this makes orphan development cheap or fast in absolute terms. The median clinical phase still runs 7.2 years from first dose to filing. But the slope of the curve is genuinely friendlier than the standard pathway, and the seven-year exclusivity that begins at approval creates a defensible commercial window that is hard to match in any other corner of biopharma.
The Medical Device Pathway

Medical devices answer to a different center entirely. CDRH regulates devices through a risk-based system that sorts every product into Class I, II, or III, and from there into one of five premarket pathways. That branching structure is what the infographic above is trying to capture, because there is no single device timeline the way there is a drug timeline.
Concept to market typically runs three to seven years, not ten. The compressed range is real, but it hides enormous variability between pathways.
The 510(k) is the workhorse. About 3,000 clearances issue every year, and the median FDA review time runs 142 days with a clearance rate near 98%. The catch is that a sponsor must identify a legally marketed predicate device and demonstrate substantial equivalence. Only about 10% of 510(k) submissions actually include clinical data. The other 90% are bench, biocompatibility, and engineering files. Since October 2023, eSTAR submission is mandatory.
The PMA sits at the opposite end. Class III devices that sustain life or present serious risk run a pivotal IDE clinical trial, file the full marketing application, and wait a median of 243 days for review. About 92% are eventually approved, often with a Post-Approval Study attached as a condition. An Advisory Panel may convene to weigh evidence in public session.
De Novo bridges the gap. It exists for novel low or moderate risk devices that have no predicate, runs 150 to 270 days, and once granted creates a new product code that competitors can later use as a predicate of their own. HDE serves the device equivalent of orphan drugs, for diseases affecting 8,000 or fewer US patients per year, and substitutes a probable-benefit standard for full effectiveness.
The closest analog to the IND on the device side is the IDE, the Investigational Device Exemption. It carries the same 30-day FDA review clock, governs Significant-Risk studies under 21 CFR 812, and lets sponsors run pivotal trials. Non-Significant-Risk device studies need only IRB approval, which is an option drug developers simply do not have.
The honest summary is that device sponsors enjoy more pathway optionality than drug sponsors, but that flexibility comes with a different kind of complexity. Choosing the wrong pathway, or misjudging your predicate, can cost a year and force a refile through an entirely different route.
The Cost of Getting to Approval
Timelines tell you how long it takes to reach an FDA decision. Costs tell you what it takes to survive the wait. Across all three pathways, the numbers in the public literature span a wide range, and the spread is not noise. It reflects two very different ways of accounting. Cash outlay measures what a single program actually spends. Capitalized expected cost layers in the cost of failed programs and the cost of capital tied up over a decade. Both are legitimate, and the gap between them is where most arguments about drug pricing actually live.
Standard drug development
The most cited figure in the industry is Tufts CSDD's $2.6 billion per approved drug, which includes failures and capitalized opportunity cost. A more recent JAMA Network Open analysis (Sertkaya 2024) put the mean cash outlay at $172.7 million per approved drug, rising to $515.8 million when failures are included and $879.3 million when capital costs are added. The two estimates are not really in conflict. They are measuring different things. What both confirm is that a single Phase 3 trial in a major therapeutic area can run $200 million at the median and $255 million on average, and that the cost per day of an ongoing Phase 3 study now sits at roughly $55,000 in direct burn. A practical planning range for a sponsor running a standard new molecular entity through CDER is $500 million to $2.6 billion fully loaded, depending on therapeutic area and whether you account for the candidates that never made it.
Orphan drug development
The rare-disease pathway is meaningfully cheaper, both per program and per approved product. AJMC's analysis of out-of-pocket clinical costs put orphan programs at roughly $166 million versus $291 million for non-orphan when adjusted for probability of clinical success. The capitalized cost per approved orphan drug ran $291 million against $412 million for non-orphan, and the gap widens further for new molecular entities, where orphans came in at $242 million versus $489 million. The pivotal trial for an orphan program typically lands between $63 million and $100 million at the median, well below the $200 million median for traditional Phase 3. The economics still ask for serious capital, but the trial sizes are smaller, the success rates are higher, and the federal incentive stack reduces effective cost further through the 25% qualifying-cost tax credit, the PDUFA fee waiver, and seven years of post-approval exclusivity that lets sponsors recoup investment without immediate generic competition. A reasonable planning range for an orphan program from first human dose to approval is $150 million to $300 million on a cash basis, with capitalized expected cost approaching $290 million per approved product.
Medical device development
The device side looks deceptively cheap on the surface and turns out to be anything but, once you know which pathway you are running. The Stanford Biodesign survey by Makower and colleagues found the average cost to bring a 510(k) device from concept to clearance was $31 million, with about 77% of that spend tied directly to FDA-related activities. A 2022 industry study tightened the range, reporting a median $3.1 million and mean $6.1 million per 510(k) program, ranging from $200,000 at the low end to $41 million at the upper extreme. De Novo programs run higher, with a median of $5 million and mean of $17.8 million in the same dataset. The PMA pathway is where the numbers get serious. The Makower study put concept-to-approval for a PMA device at $94 million on average, with the clinical trial stage alone consuming about 51% of total spend. The Sertkaya 2022 JAMA Network Open study, which applied the same capitalized methodology used for drugs, estimated mean cash outlay at $54 million per approved complex device and a capitalized expected cost of $522 million once failures and cost of capital are layered in. That last figure is the one to remember. On a methodologically comparable basis, a Class III device costs roughly 60% of what a standard drug costs to develop, not the order-of-magnitude discount that the headline 510(k) numbers might suggest. FDA user fees themselves are almost a rounding error, ranging from $26,067 for a standard 510(k) to $579,272 for an original PMA in fiscal year 2026 per the MDUFA schedule, with substantial small-business discounts available.
What the cost data actually tells you
The pattern across all three pathways is consistent. Cash outlay for a single successful program runs in the tens to low hundreds of millions. Capitalized expected cost, the figure that matters for portfolio-level decisions, runs three to ten times higher because it absorbs the dead programs and the years of capital sitting idle. For founders raising capital, the 510(k) number you quote to investors is the cash figure, somewhere between $3 million and $31 million depending on complexity. For institutional allocators thinking about sector returns, the relevant figure is the capitalized one, and that is where the device, orphan drug, and standard drug pathways converge into the same expensive game played at slightly different scales.
Summary Comparison
The three pathways look more alike at a high level than they do in the trenches. Each starts with preclinical work, each ends with an FDA decision, and each has a statutory review clock that the agency tries to honor. What separates them is the depth of evidence required, the size and length of clinical work, and the probability that any given candidate makes it across the finish line.
Side-by-side timeline and outcome comparison
| Dimension | Standard Drug | Orphan Drug | Medical Device |
|---|---|---|---|
| Review center | CDER | CDER (with OOPD designation) | CDRH |
| Concept to market | About 10 years | 8 to 9 years | 3 to 7 years |
| Median clinical phase | About 8 years | 7.2 years | 1 to 5 years (PMA highest) |
| Pivotal trial gatekeeper | IND (30-day review) | IND (30-day review) | IDE (30-day review) |
| Marketing application | NDA / BLA | NDA / BLA (PDUFA waived) | 510(k), De Novo, PMA, or HDE |
| Median FDA review time | 10 months standard, 6 months priority | 244 days | 142 days (510(k)); 243 days (PMA) |
| Approval rate at final review | 90.6% | 93.6% | 98% (510(k)); 92% (PMA) |
| Overall LOA from first human study | 7.9% | 17.0% | Not directly comparable (risk-class dependent) |
| Headline incentives | Patent term + standard PDUFA review | 7-yr exclusivity, 25% tax credit, fee waiver | Pathway selection flexibility; HDE for rare conditions |
| Where most candidates die | Phase 2 (28.9% transition) | Phase 2 (44.6%, still the lowest gate) | Predicate selection / pathway choice |
| Cash outlay per approved product | $172.7M | About $55M out-of-pocket (clinical only) | $3.1M median 510(k); $54M PMA |
| Capitalized expected cost (incl. failures + cost of capital) | $879M to $2.6B | $242M to $291M | $31M for 510(k) (Makower); $522M for PMA |
| Typical FDA user fee (FY 2026) | $4.3M PDUFA filing | Waived under ODD | $26K (510(k)); $174K (De Novo); $579K (PMA) |
A standard drug program is the longest, the most expensive, and the riskiest. An orphan drug program runs on the same scientific spine but with a friendlier slope and a stronger exclusivity moat at the end. A device program trades a single long pathway for five shorter ones, where the strategic question shifts from "can we generate the evidence" to "which pathway do we choose, and which predicate do we cite."
For anyone allocating capital across this landscape, the takeaway is that timeline math alone is misleading. A 510(k) device can reach market in three years and still represent a thinner commercial position than an orphan drug that takes eight. The pathway tells you how to get there. It does not tell you what waits on the other side.
Sources: FDA CDER and CDRH program pages, BIO Industry Analysis (2021), Frontiers in Medicine (2024), Friends of Cancer Research, Nature Reviews Drug Discovery, HHS ASPE (2022), Tufts CSDD (2014 and 2024), JAMA Network Open (Sertkaya 2022, 2024), Stanford Biodesign / Makower et al. (2010), AJMC (2020), Health Advances (2019), Medical Design & Outsourcing (2022).
